blog it,
About the author
- Olli K. aka. gildean
- On the internet since 1995.
- Fair amount of experience with networks and computers.
- Likes javascript.
- Find me on irc
Raspberry Pi thermometer with node.js
June 1, 2013 | Comments | Tags: javascript , node.js , raspi
Building a web-enabled thermometer from a raspi is a fun and relatively easy project.
Picking out the sensor and building a simple harness
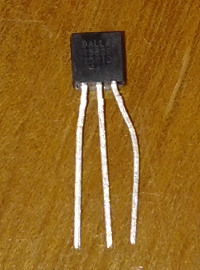
Like so many other rpi thermometer builds, I chose the DS18B20 single wire digital temperature sensor, as it’s quite accurate for its really cheap price.
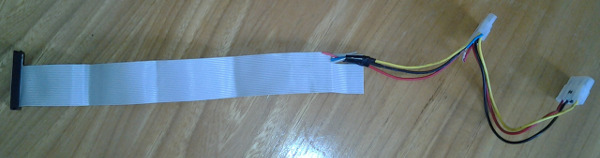
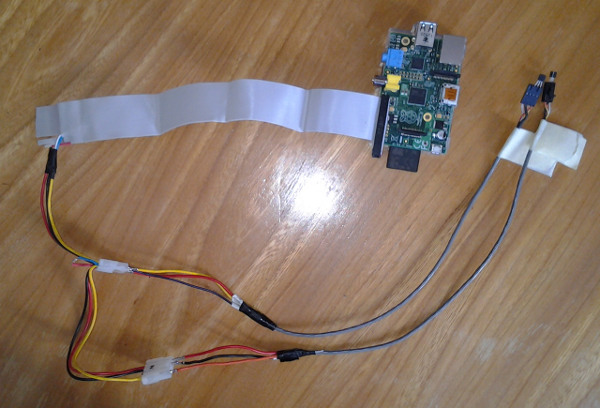
For the wiring I used parts from an old broken computer, a floppy-disk cable to connect to the Pi, and some cables from the PSU with the molex-connectors intact. I’m planning to upgrade this into some rj-45 jacks instead, so I can easily make some longer cables with cat-6.
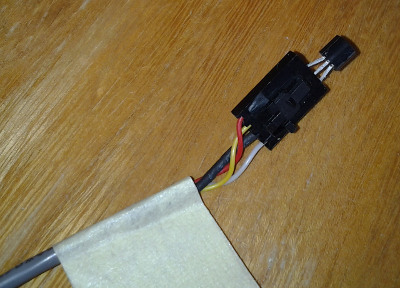
For now the sensors sit on top of an old CDA-cable, that i cut in half and soldered some connectors on the other end to fit the molex-connectors on the harness.
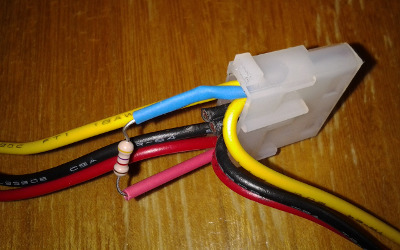
The sensors need to be pulled down with a 4.7K ohm resistor, which i just stuck in one of the molexes in the harness.
Here is the basic schematic of the connections
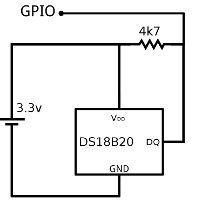
And here is the finished product
As you can see, you can use multiple sensors on the same wires, no need to use multiple pins on the pi.
Building an application
I wanted to make the app at least somewhat modular and extensible, so that it could use different ways of storing the data and use an arbitrary number of sensors.
To achieve this goal with the least amount of effort, I just wrote a simple JSON-file to be used as the config. In the file you can: set up your sensors, set up your database, set a refresh-rate and a css-theme.
Where to put the data?
For the db in the initial build I chose the most used store for timeseries data; RRD. Fortunately there are a couple of different modules for node to use RRD, from which I picked the node rrd. With a little tinkering, I wrote a “driver” to be used that creates a new RRD-file if none exists, and does searches properly as RRD requires the timespan to be divisble with the interval of the RRA. This module also requires for the RRDtool to be installed, but that just required a quick sudo apt-get install rrdtool.
Serving the data
As the rpi normally runs with an SD-card, I didn’t want to put too much stress on the disk and therefore wrote the HTTP-server to run completely in-memory. And because the device might be set up somewhere with poor internet-connection, I made the HTTP-server also save a Gzipped and a deflated version of each file, and added a simple etagging-function to run as well. The HTML and CSS are also concatted at startup, as are the two js-files.
For the application to be nice and real-timey, I included a WebSocket-server to the mix. All the requests from the frontend after the initial page-load are made through the WebSocket-connection, which also helps to keep the network-traffic to a minimum. The server sends new updates every 30 seconds so the page can be used as an actual thermometer. With the websocket-server being the actual way of serving the data, the web-page isn't the only option when creating a client either.
Something to look at
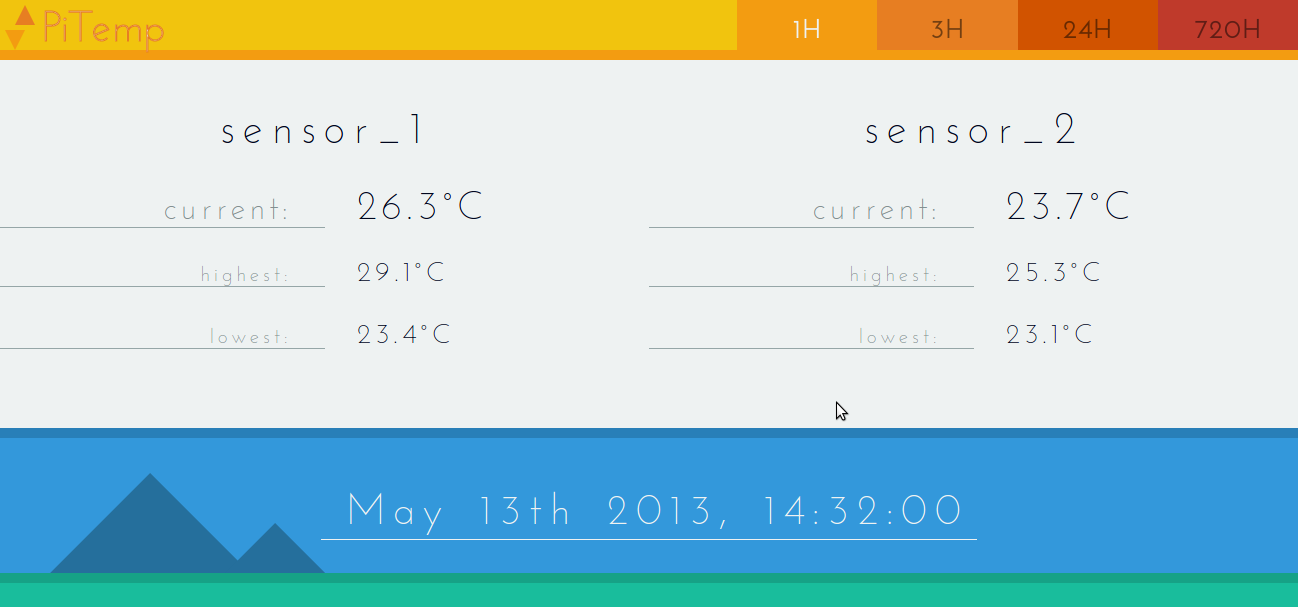
The frontend itself is a fairly simple mix of HTML, CSS and JavaScript with the ability to change the color-theme with a separate CSS-file. The elements for each sensor are built on pageload, so the frontend could also be used with as many sensors as wanted.
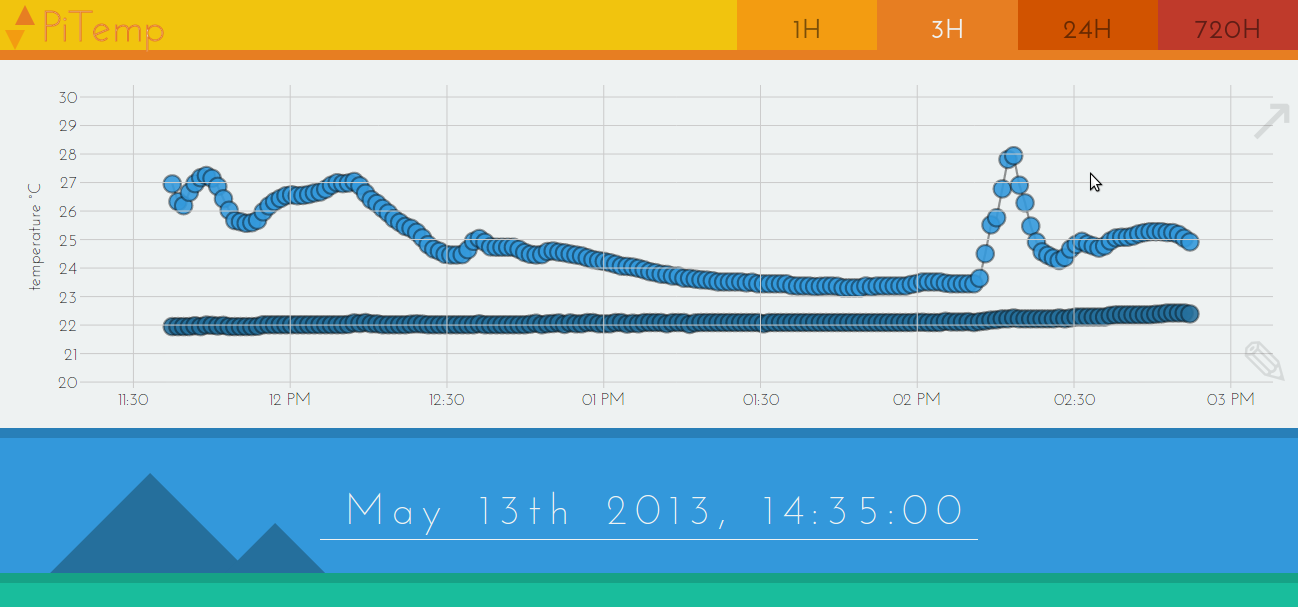
For the graphs I decided to use D3.js and make the graphs zoomable and pannable, so a graph with a large number of datapoints would be more usable. Here’s a sample of the graphs:
Conclusion
In the end the application was fairly simple to create and should be extensible at least to a certain degree. In the future I’ll also add an alert system that can be configured to send emails if the temperature drops or rises over a set mark.
The complete source can be viewed/forked/cloned at https://github.com/gildean/PiTherm.
If you have any ideas or complaints, please post a comment below.
comments powered by Disqus